Edit chart
Loading graph
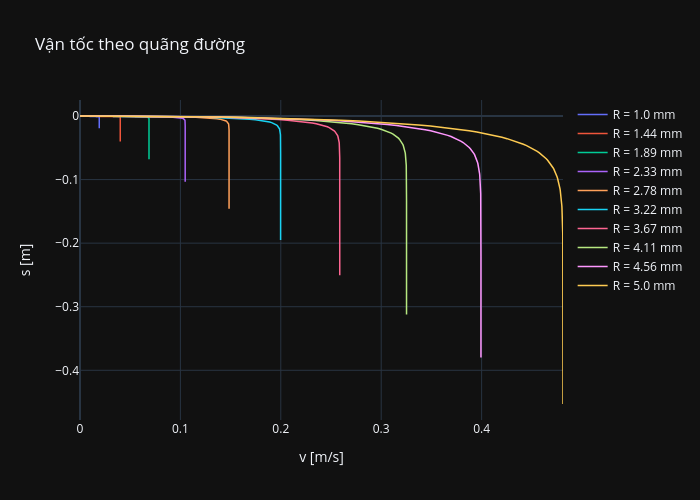
Haicat's interactive graph and data of "Vận tốc theo quãng đường" is a line chart, showing R = 1.0 mm, R = 1.44 mm, R = 1.89 mm, R = 2.33 mm, R = 2.78 mm, R = 3.22 mm, R = 3.67 mm, R = 4.11 mm, R = 4.56 mm, R = 5.0 mm; with v [m/s] in the x-axis and s [m] in the y-axis.. The x-axis shows values from 0 to 0. The y-axis shows values from 0 to 0.