Edit chart
Loading graph
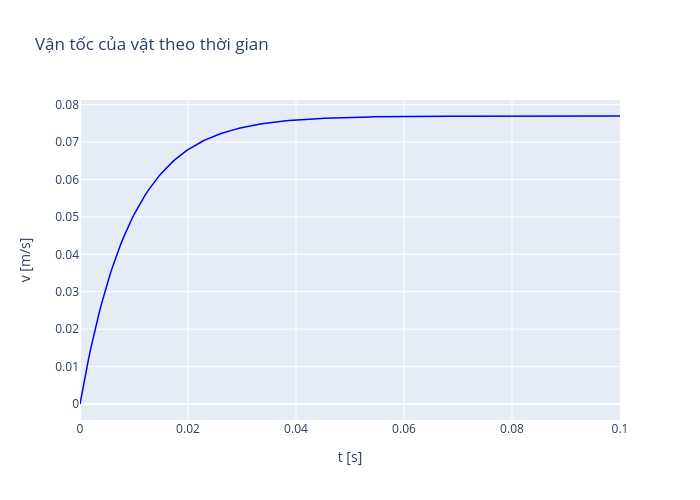
Haicat's interactive graph and data of "Vận tốc của vật theo thời gian" is a line chart, showing Vận tốc; with t [s] in the x-axis and v [m/s] in the y-axis.. The x-axis shows values from 0 to 0. The y-axis shows values from 0 to 0.