Edit chart
Loading graph
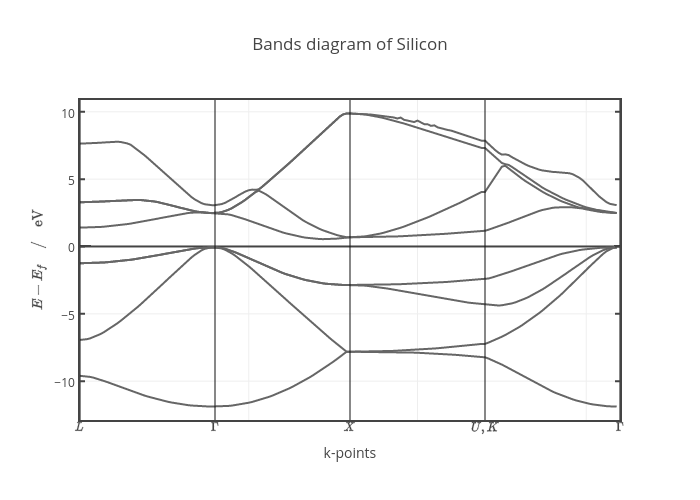
Gvallverdu's interactive graph and data of "Bands diagram of Silicon" is a line chart; with k-points in the x-axis and $E - E_f \quad / \quad \text{eV}$ in the y-axis.. The x-axis shows values from 0 to 160. The y-axis shows values from -12.88395692 to 10.87534308. This visualization has the following annotations: $L$; $\Gamma$; $X$; $U,K$; $\Gamma$