Edit chart
Loading graph
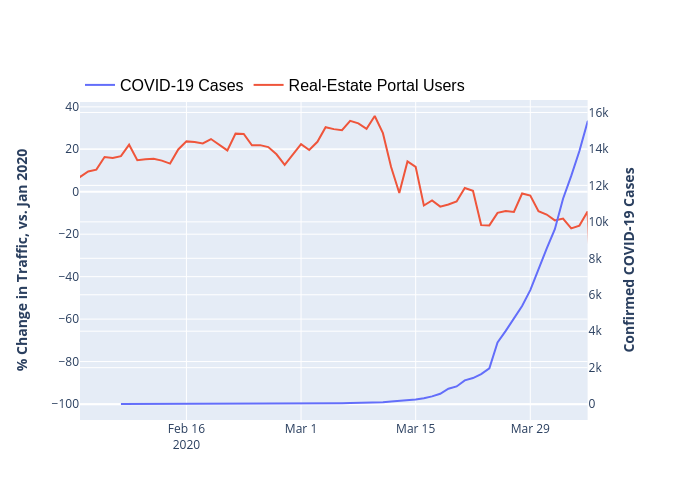
Guyll's interactive graph and data of "COVID-19 Cases vs Real-Estate Portal Users" is a line chart, showing COVID-19 Cases vs Real-Estate Portal Users; with % Change in Traffic, vs. Jan 2020 in the y-axis. The x-axis shows values from 2020-02-03T00:00:00 to 2020-04-05T00:00:00. The y-axis shows values from 0 to 0.