Edit chart
Loading graph
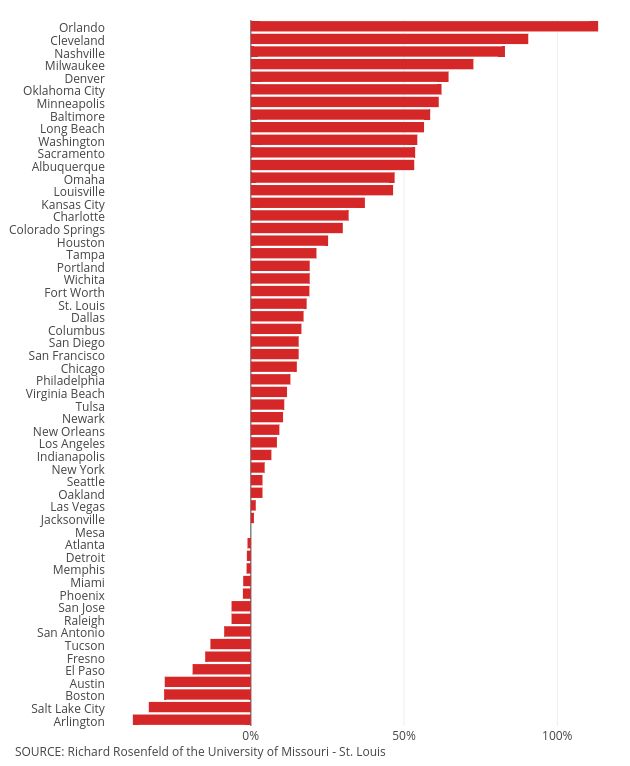
Governing's interactive graph and data of "Col2" is a bar chart, showing Col2. The x-axis shows values from -46.93333333333334 to 121.73333333333333. The y-axis shows values from 55.5 to -0.5. This visualization has the following annotation: SOURCE: Richard Rosenfeld of the University of Missouri - St. Louis