Edit chart
Loading graph
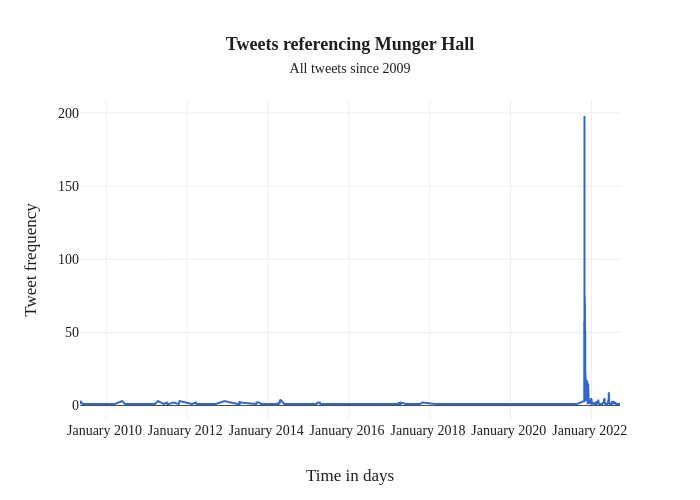
Gnunnelley's interactive graph and data of "Tweets referencing Munger HallAll tweets since 2009" is a line chart; with Time in days in the x-axis and Tweet frequency in the y-axis.. The x-axis shows values from 2009-05-09 to 2022-09-15. The y-axis shows values from -9.944444444444445 to 208.94444444444446.