Edit chart
Loading graph
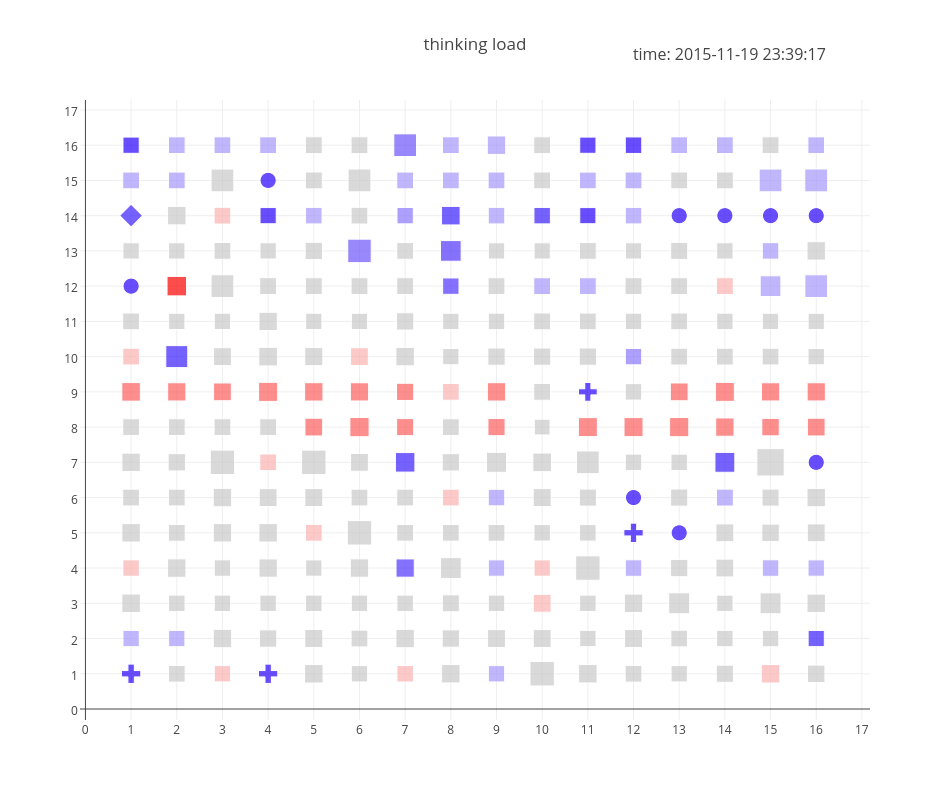
Gjbex's interactive graph and data of "thinking load" is a scatter chart. The x-axis shows values from 0 to 0. The y-axis shows values from 0 to 0. This visualization has the following annotation: time: 2015-11-19 23:39:17