Edit chart
Loading graph
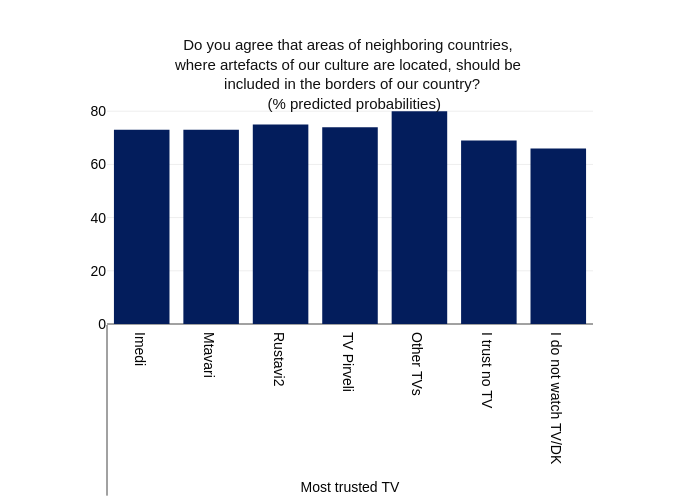
Givisilll's interactive graph and data of "Do you agree that areas of neighboring countries, where artefacts of our culture are located, should be included in the borders of our country? (% predicted probabilities)" is a bar chart. The x-axis shows values from -0.5 to 6.5. The y-axis shows values from 0 to 84.21052631578948.