Edit chart
Loading graph
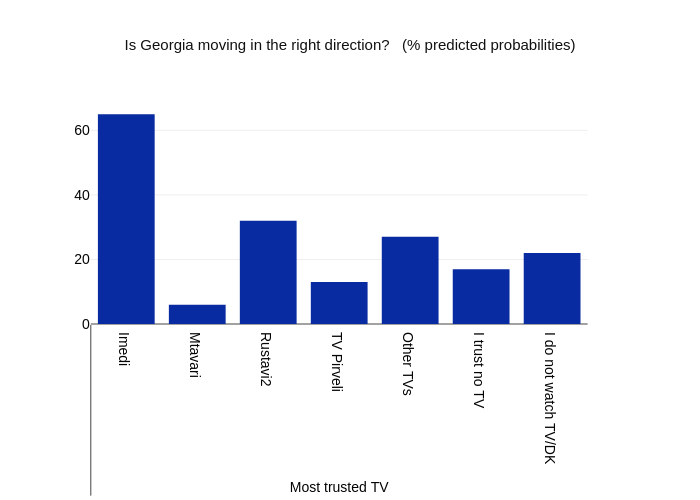
Givisilll's interactive graph and data of "Is Georgia moving in the right direction? (% predicted probabilities)" is a bar chart. The x-axis shows values from -0.5 to 6.5. The y-axis shows values from 0 to 68.42105263157895.