Edit chart
Loading graph
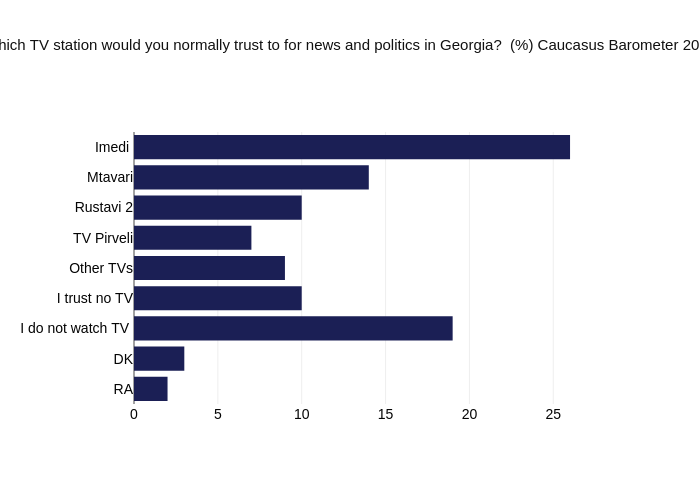
Givisilll's interactive graph and data of "Which TV station would you normally trust to for news and politics in Georgia? (%) Caucasus Barometer 2020" is a bar chart. The x-axis shows values from 0 to 27.36842105263158. The y-axis shows values from -0.5 to 8.5.