Edit chart
Loading graph
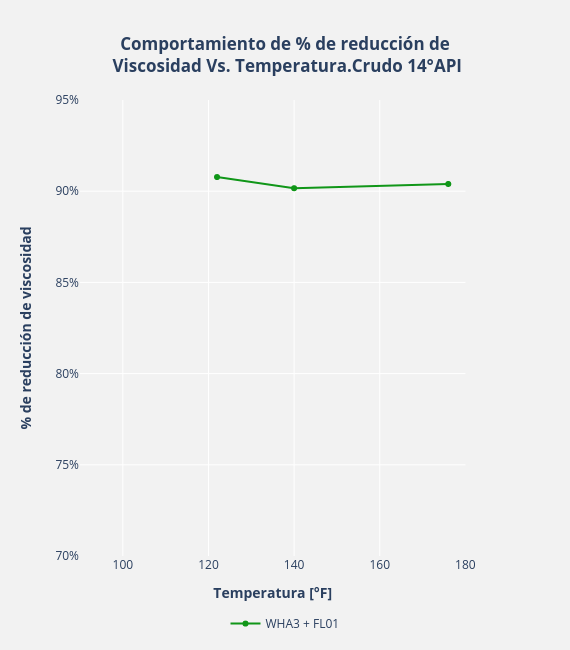
Gaboperezayala's interactive graph and data of "Comportamiento de % de reducción de Viscosidad Vs. Temperatura.Crudo 14°API" is a scatter chart, showing WHA3 + FL01; with Temperatura [°F] in the x-axis and % de reducción de viscosidad in the y-axis.. The x-axis shows values from 90 to 180. The y-axis shows values from 0.7 to 0.95.