Edit chart
Loading graph
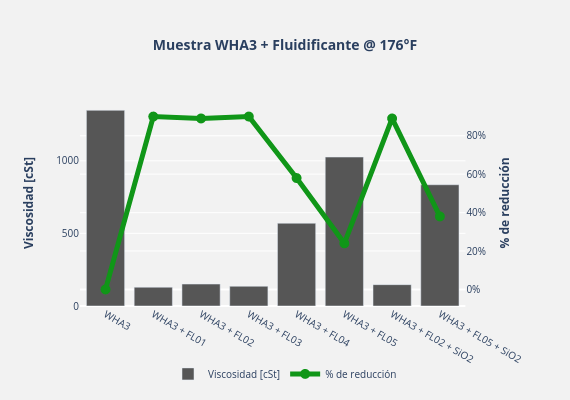
Gaboperezayala's interactive graph and data of "Muestra WHA3 + Fluidificante @ 176°F" is a bar chart, showing Viscosidad [cSt] vs % de reducción; with Viscosidad [cSt] in the y-axis. The x-axis shows values from 0 to 0. The y-axis shows values from 0 to 0.