Edit chart
Loading graph
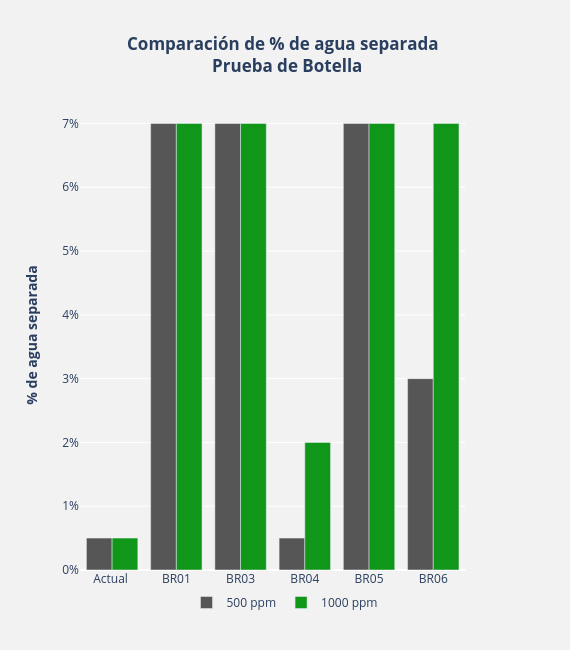
Gaboperezayala's interactive graph and data of "Comparación de % de agua separada Prueba de Botella" is a bar chart, showing 500 ppm vs 1000 ppm; with % de agua separada in the y-axis. The x-axis shows values from 0 to 0. The y-axis shows values from 0 to 0.