Edit chart
Loading graph
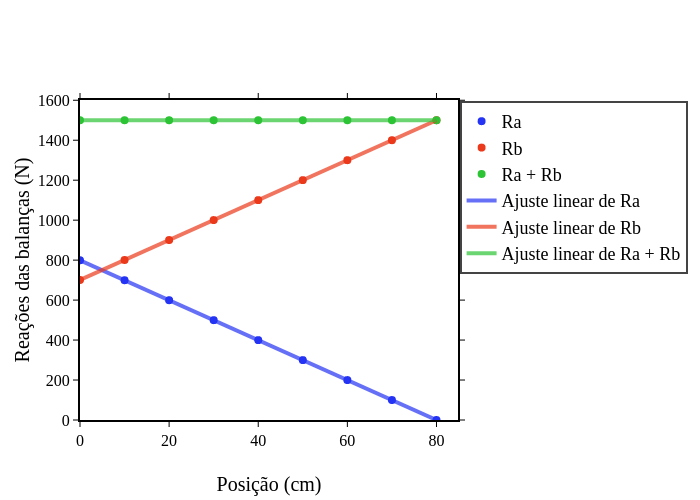
Fisolofofabiograbiel's interactive graph and data of "Reações das balanças (N) vs Posição (cm)" is a scatter chart, showing Ra, Rb, Ra + Rb, Ajuste linear de Ra, Ajuste linear de Rb, Ajuste linear de Ra + Rb; with Posição (cm) in the x-axis and Reações das balanças (N) in the y-axis.. The x-axis shows values from 0 to 84.82788370287292. The y-axis shows values from 0 to 1601.281499030799.