Edit chart
Loading graph
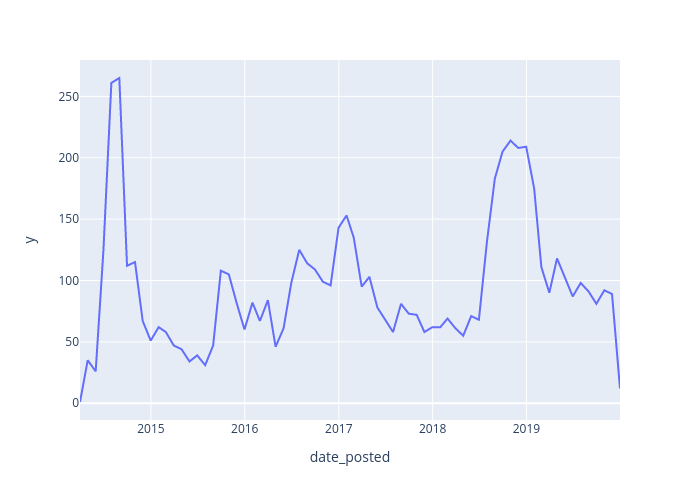
Felix.vemmer's interactive graph and data of "y vs date_posted" is a line chart; with date_posted in the x-axis and y in the y-axis.. The x-axis shows values from 0 to 0. The y-axis shows values from 0 to 0.