Edit chart
Loading graph
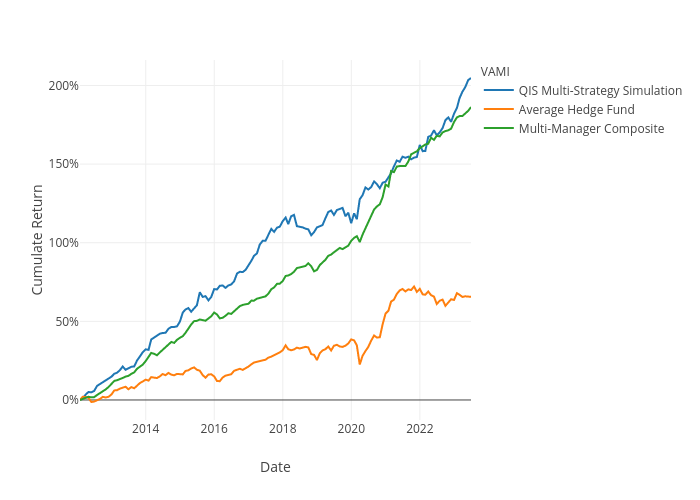
F_midd01's interactive graph and data of "Cumulate Return vs Date" is a line chart, showing QIS Multi-Strategy Simulation, Average Hedge Fund, Multi-Manager Composite; with Date in the x-axis and Cumulate Return in the y-axis.. The x-axis shows values from 2012-01-31 to 2023-06-30. The y-axis shows values from -12.736676528108383 to 216.19685403405924.