Edit chart
Loading graph
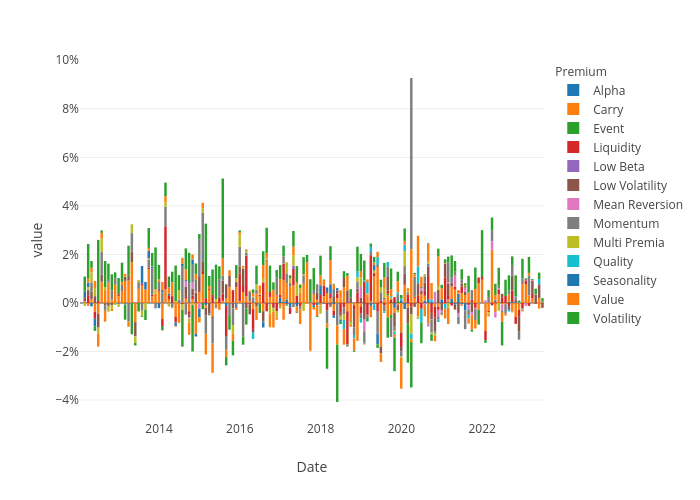
F_midd01's interactive graph and data of "value vs Date" is a , showing Alpha, Carry, Event, Liquidity, Low Beta, Low Volatility, Mean Reversion, Momentum, Multi Premia, Quality, Seasonality, Value, Volatility; with Date in the x-axis and value in the y-axis.. The x-axis shows values from 0 to 0. The y-axis shows values from 0 to 0.