Edit chart
Loading graph
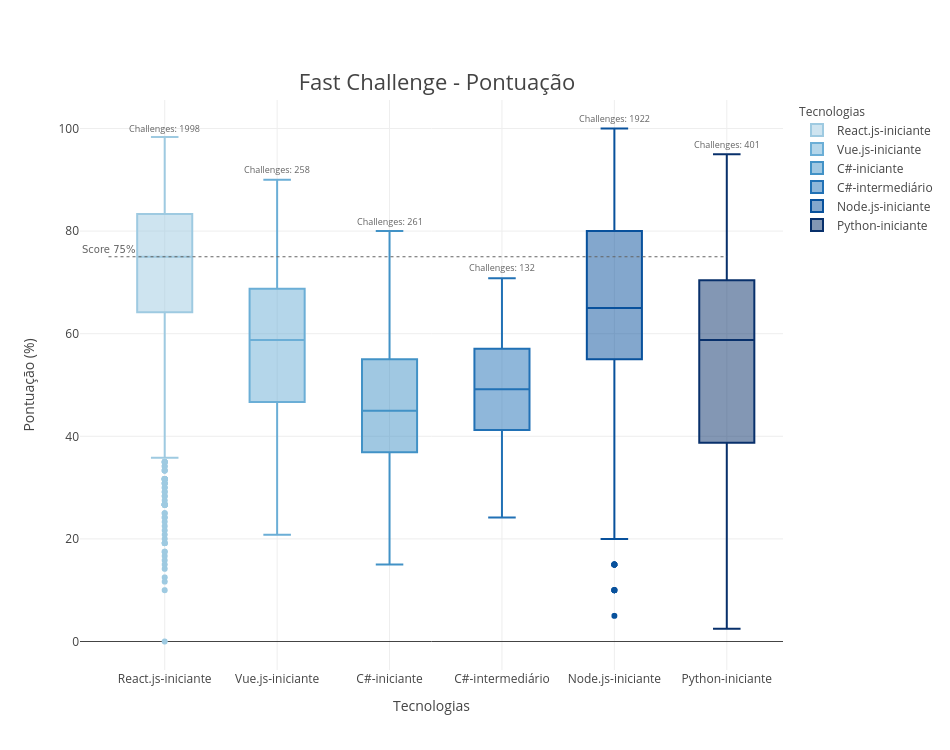
F.rastelli's interactive graph and data of "Fast Challenge - Pontuação" is a box plot, showing React.js-iniciante, Vue.js-iniciante, C#-iniciante, C#-intermediário, Node.js-iniciante, Python-iniciante; with Tecnologias in the x-axis and Pontuação (%) in the y-axis.. The x-axis shows values from 0 to 0. The y-axis shows values from 0 to 0. This visualization has the following annotations: Challenges: 1998; Challenges: 258; Challenges: 261; Challenges: 132; Challenges: 1922; Challenges: 401; Score 75%