Edit chart
Loading graph
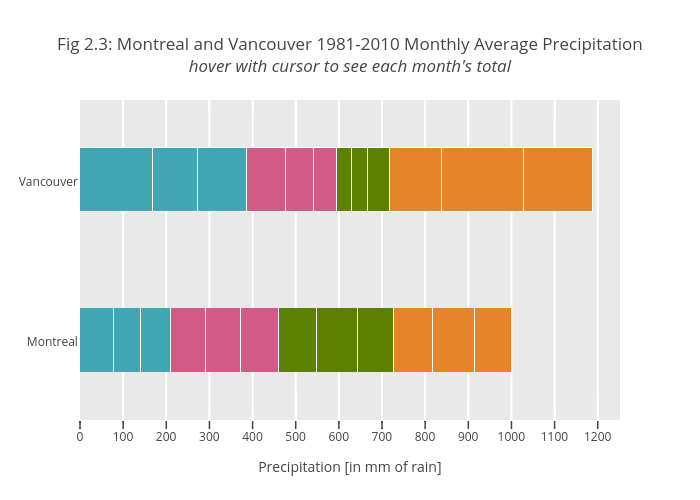
Etpinard's interactive graph and data of "Fig 2.3: Montreal and Vancouver 1981-2010 Monthly Average Precipitationhover with cursor to see each month's total" is a stacked bar chart, showing January, February, March, April, May, June, July, August, September, October, November, December; with Precipitation [in mm of rain] in the x-axis. The x-axis shows values from 0 to 0. The y-axis shows values from 0 to 0.