Edit chart
Loading graph
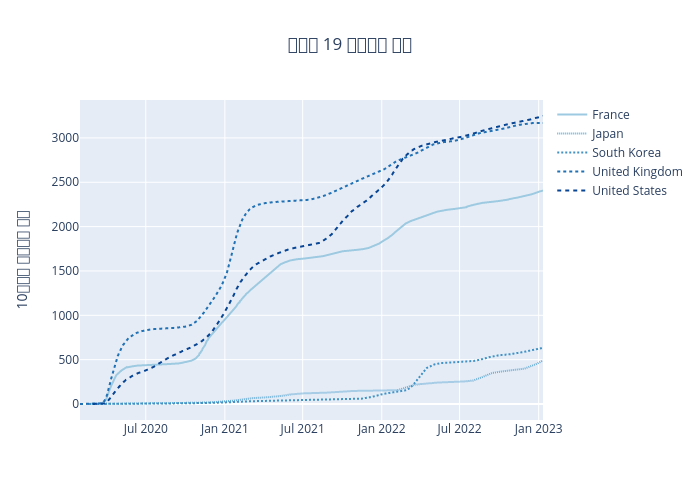
Estndard's interactive graph and data of "코로나 19 사망자수 추세" is a line chart, showing France, Japan, South Korea, United Kingdom, United States; with 10만명당 사망자수 누계 in the y-axis. The x-axis shows values from 0 to 0. The y-axis shows values from 0 to 0.