Edit chart
Loading graph
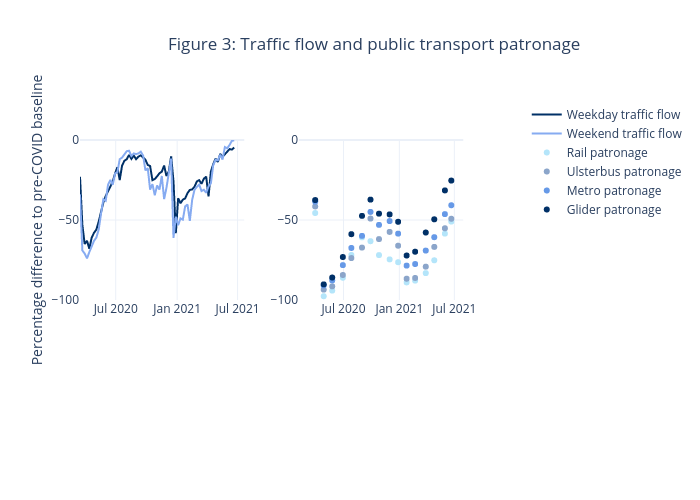
Erobson's interactive graph and data of "Figure 3: Traffic flow and public transport patronage" is a line chart, showing Weekday traffic flow, Weekend traffic flow, Rail patronage, Ulsterbus patronage, Metro patronage, Glider patronage; with time in the x-axis and Percentage difference to pre-COVID baseline in the y-axis.. The x-axis shows values from 2020-03-16 to 2021-07-21 . The y-axis shows values from -100 to 0.