Edit chart
Loading graph
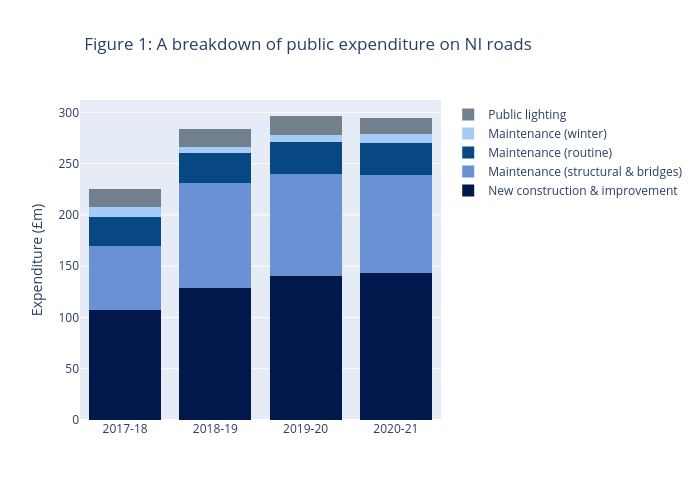
Erobson's interactive graph and data of "Figure 1: A breakdown of public expenditure on NI roads" is a stacked bar chart, showing New construction & improvement, Maintenance (structural & bridges), Maintenance (routine), Maintenance (winter), Public lighting; with Expenditure (£m) in the y-axis. The x-axis shows values from -0.5 to 3.5. The y-axis shows values from 0 to 312.00000000000006.