Edit chart
Loading graph
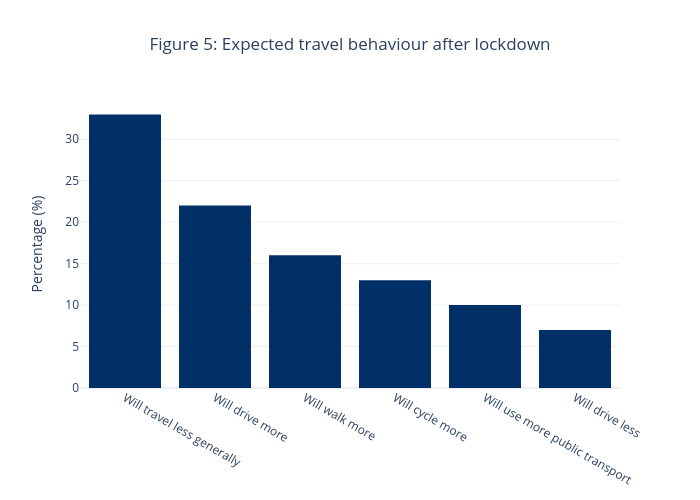
Erobson's interactive graph and data of "Figure 5: Expected travel behaviour after lockdown" is a bar chart; with Percentage (%) in the y-axis. The x-axis shows values from -0.5 to 5.5. The y-axis shows values from 0 to 34.73684210526316.