Edit chart
Loading graph
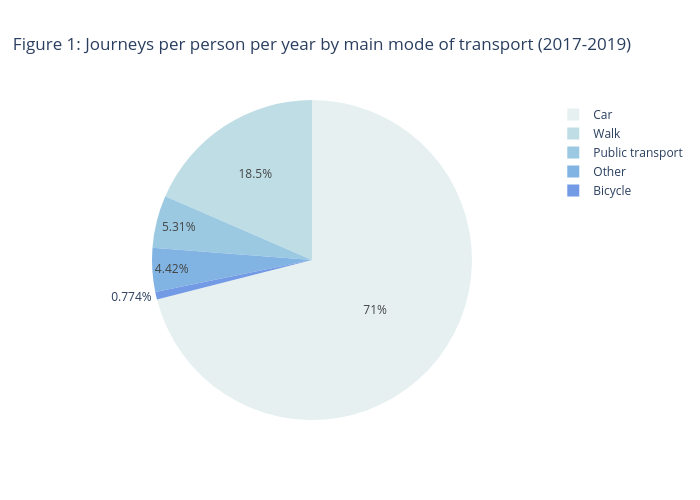
Erobson's interactive graph and data of "Figure 1: Journeys per person per year by main mode of transport (2017-2019)" is a pie. The x-axis shows values from -1 to 6. The y-axis shows values from -1 to 4.