Edit chart
Loading graph
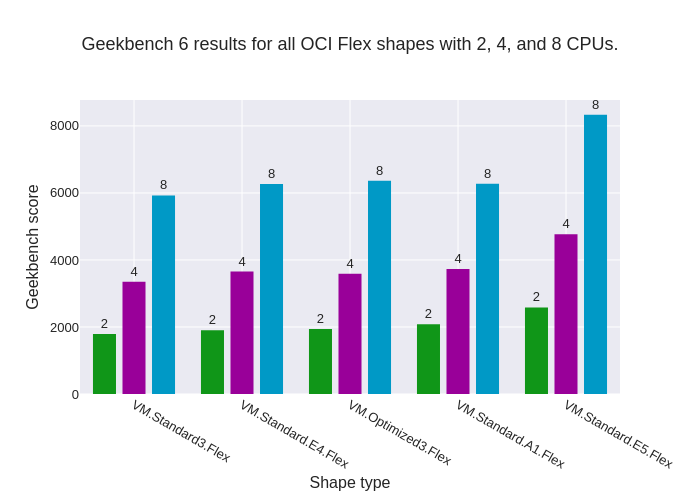
Enricopesce's interactive graph and data of "Geekbench 6 results for all OCI Flex shapes with 2, 4, and 8 CPUs." is a bar chart; with Shape type in the x-axis and Geekbench score in the y-axis.. The x-axis shows values from -0.5 to 4.5. The y-axis shows values from 0 to 8773.684210526317.