Edit chart
Loading graph
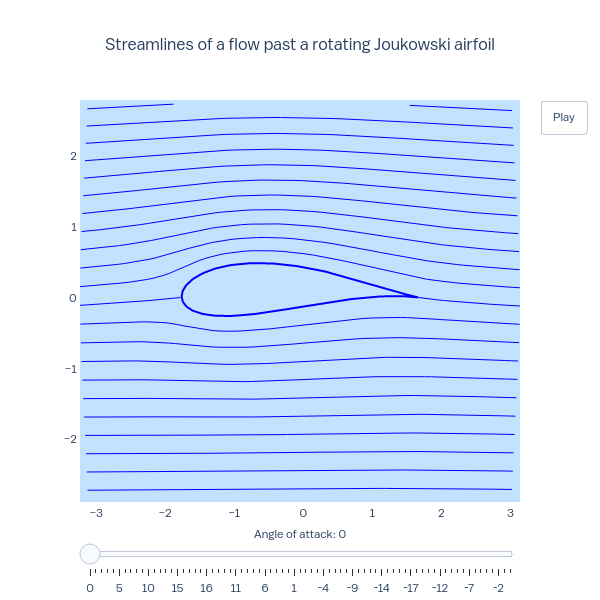
Empet's interactive graph and data of "Streamlines of a flow past a rotating Joukowski airfoil" is a line chart, showing vs . The x-axis shows values from -3.2314814814814814 to 3.1394636015325723. The y-axis shows values from -2.884259259259259 to 2.7843257387197706.