Edit chart
Loading graph
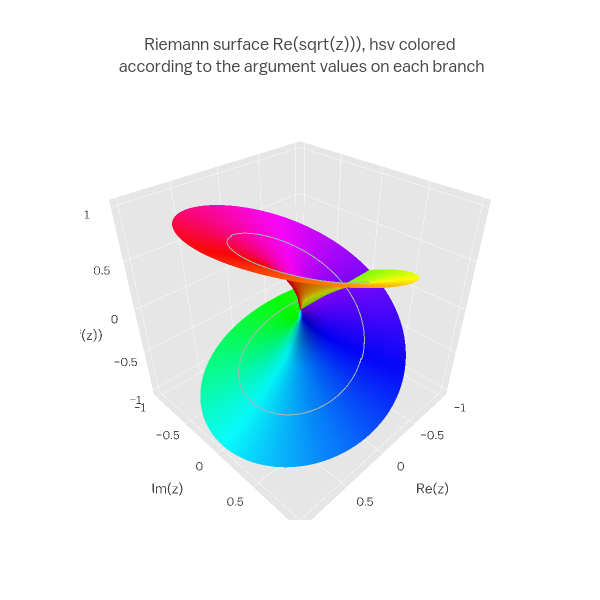
Empet's interactive graph and data of "Riemann surface Re(sqrt(z))), hsv colored according to the argument values on each branch" is a surface. The x-axis shows values from 0 to 0. The y-axis shows values from 0 to 0.