Edit chart
Loading graph
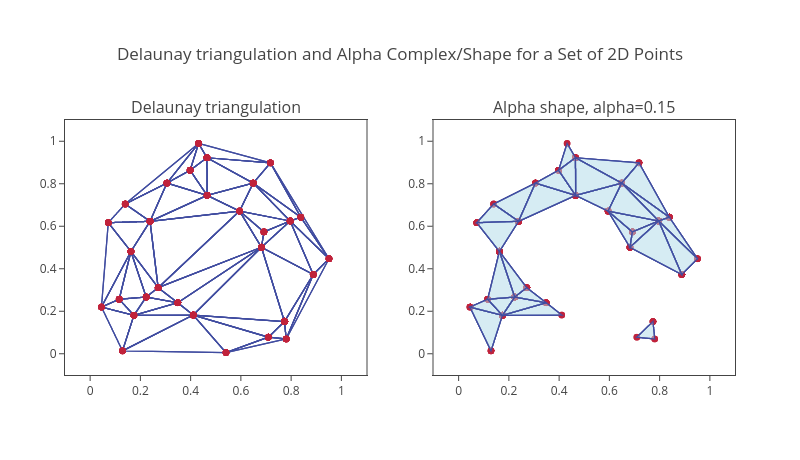
Empet's interactive graph and data of "Delaunay triangulation and Alpha Complex/Shape for a Set of 2D Points" is a , showing , , , . The x-axis shows values from -0.1 to 1.1. The y-axis shows values from -0.1 to 1.1. This visualization has the following annotations: Delaunay triangulation; Alpha shape, alpha=0.15