Edit chart
Loading graph
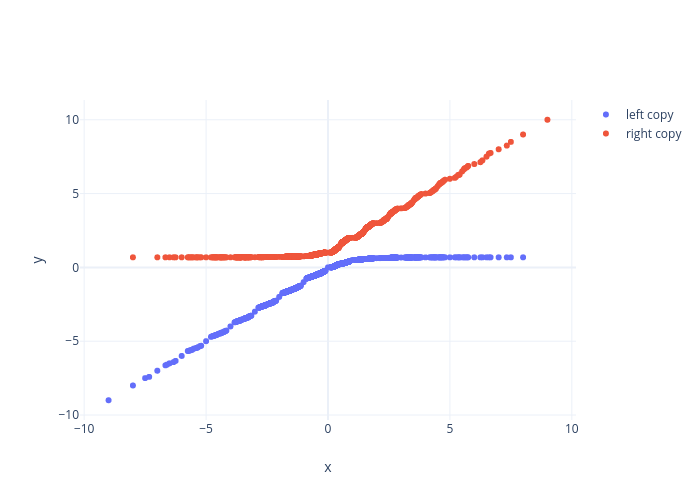
Emarzion's interactive graph and data of "y vs x" is a scatter chart, showing left copy vs right copy; with x in the x-axis and y in the y-axis.. The x-axis shows values from -10.109265734265733 to 10.109265734265733. The y-axis shows values from -10.334213305174234 to 11.334213305174234.