Edit chart
Loading graph
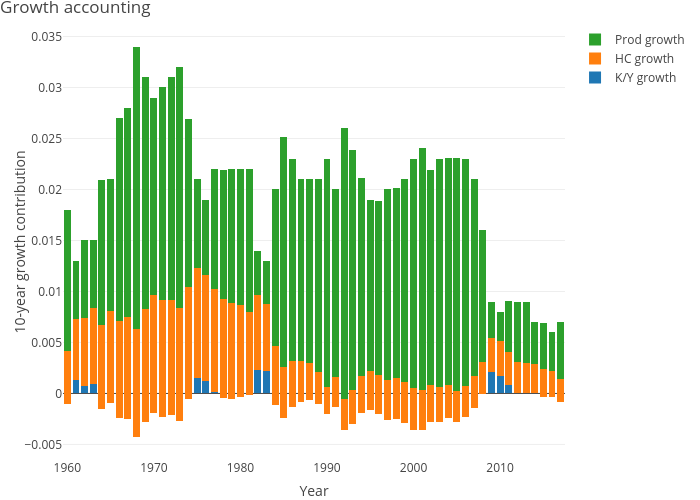
Dvollrath's interactive graph and data of "Growth accounting" is a stacked bar chart, showing K/Y growth, HC growth, Prod growth; with Year in the x-axis and 10-year growth contribution in the y-axis.. The x-axis shows values from 0 to 0. The y-axis shows values from 0 to 0.