Edit chart
Loading graph
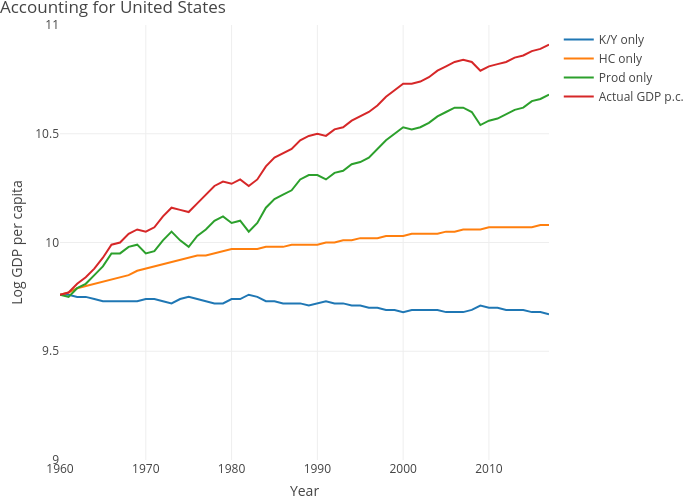
Dvollrath's interactive graph and data of "Accounting for United States" is a line chart, showing K/Y only, HC only, Prod only, Actual GDP p.c.; with Year in the x-axis and Log GDP per capita in the y-axis.. The x-axis shows values from 0 to 0. The y-axis shows values from 9 to 11.