Edit chart
Loading graph
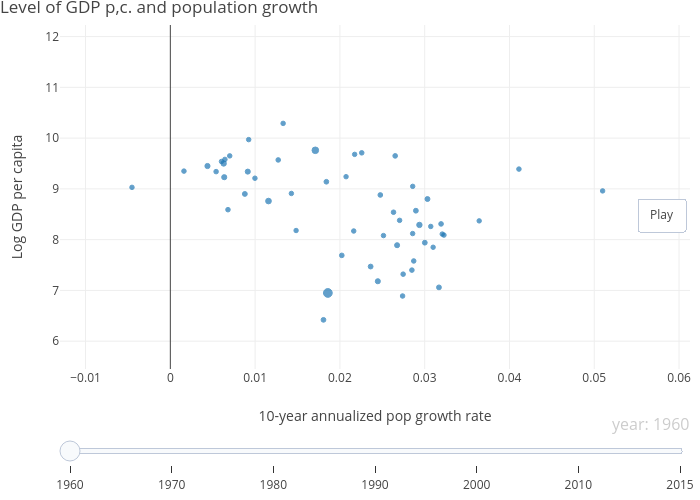
Dvollrath's interactive graph and data of "Level of GDP p,c. and population growth" is a scatter chart; with 10-year annualized pop growth rate in the x-axis and Log GDP per capita in the y-axis.. The x-axis shows values from -0.0130126437664506 to 0.0612935099455243. The y-axis shows values from 5.452 to 12.228.