Edit chart
Loading graph
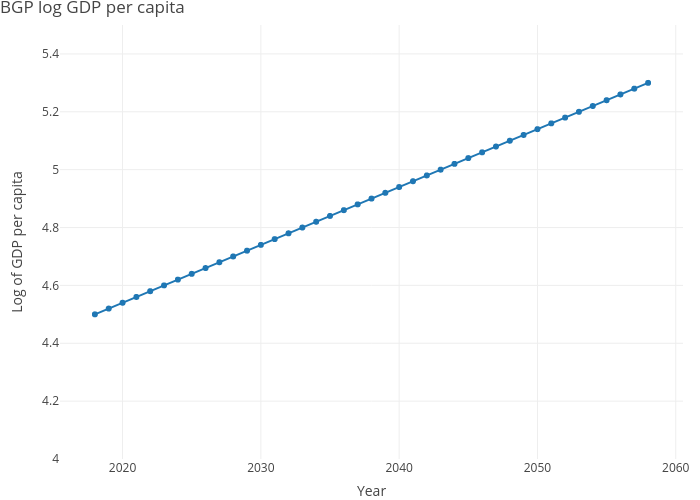
Dvollrath's interactive graph and data of "BGP log GDP per capita" is a line chart; with Year in the x-axis and Log of GDP per capita in the y-axis.. The x-axis shows values from 0 to 0. The y-axis shows values from 4 to 5.5.