Edit chart
Loading graph
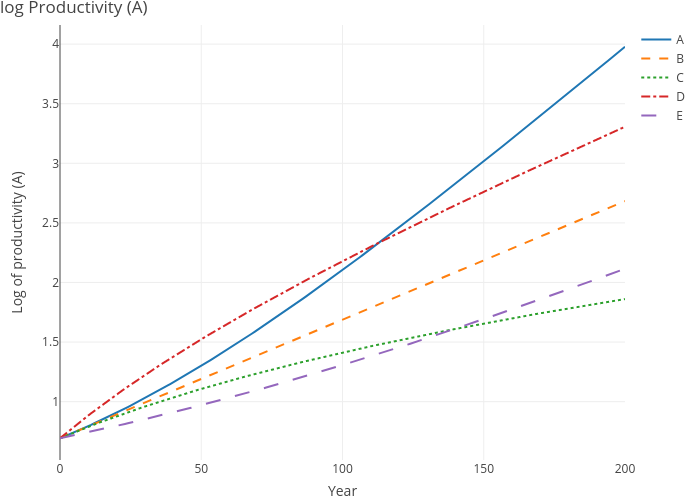
Dvollrath's interactive graph and data of "log Productivity (A)" is a line chart, showing A, B, C, D, E; with Year in the x-axis and Log of productivity (A) in the y-axis.. The x-axis shows values from 0 to 0. The y-axis shows values from 0 to 0.