Edit chart
Loading graph
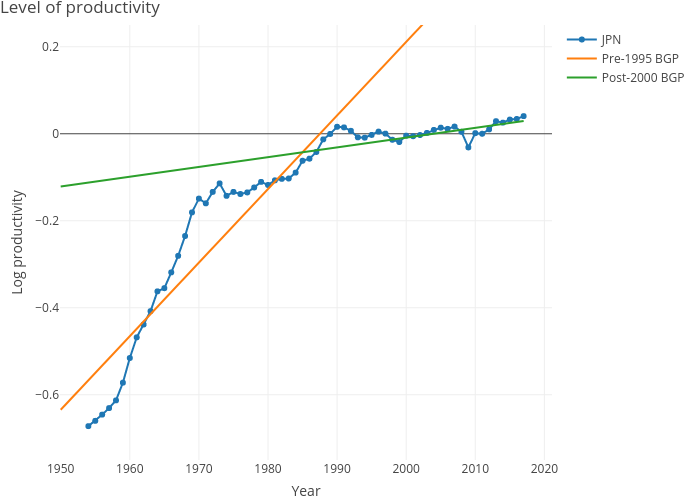
Dvollrath's interactive graph and data of "Level of productivity" is a line chart, showing JPN, Pre-1995 BGP, Post-2000 BGP; with Year in the x-axis and Log productivity in the y-axis.. The x-axis shows values from 0 to 0. The y-axis shows values from -0.75 to 0.25.