Edit chart
Loading graph
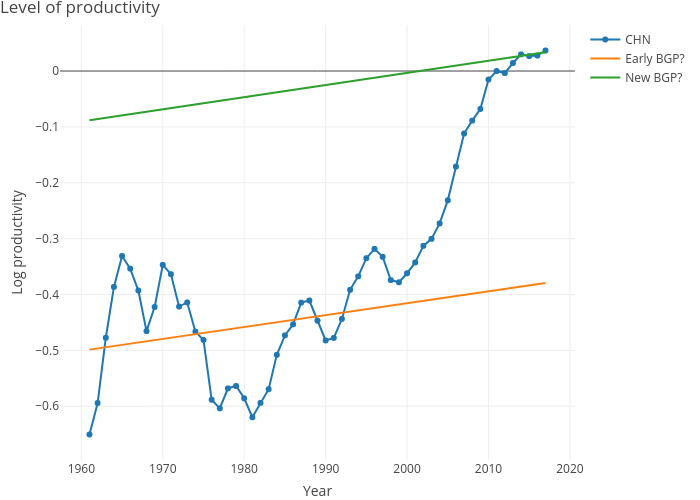
Dvollrath's interactive graph and data of "Level of productivity" is a line chart, showing CHN, Early BGP?, New BGP?; with Year in the x-axis and Log productivity in the y-axis.. The x-axis shows values from 0 to 0. The y-axis shows values from 0 to 0.