Edit chart
Loading graph
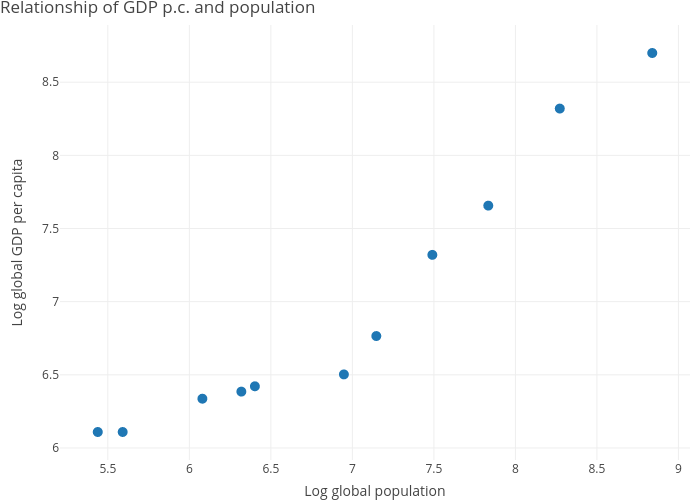
Dvollrath's interactive graph and data of "Relationship of GDP p.c. and population" is a scatter chart; with Log global population in the x-axis and Log global GDP per capita in the y-axis.. The x-axis shows values from 0 to 0. The y-axis shows values from 0 to 0.