Edit chart
Loading graph
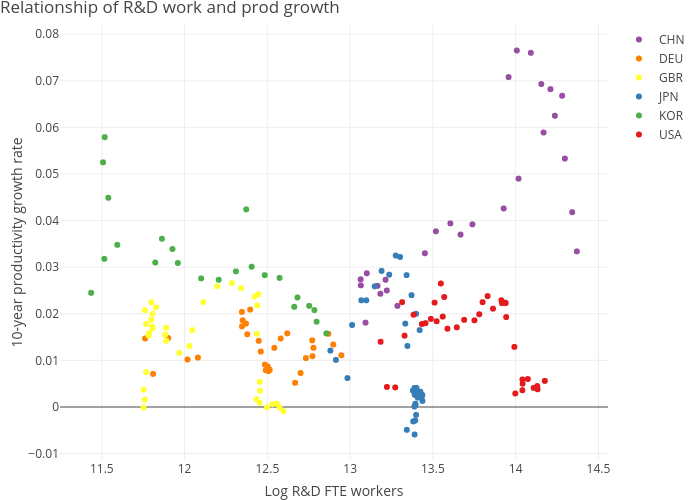
Dvollrath's interactive graph and data of "Relationship of R&D work and prod growth" is a scatter chart, showing CHN, DEU, GBR, JPN, KOR, USA; with Log R&D FTE workers in the x-axis and 10-year productivity growth rate in the y-axis.. The x-axis shows values from 0 to 0. The y-axis shows values from 0 to 0.