Edit chart
Loading graph
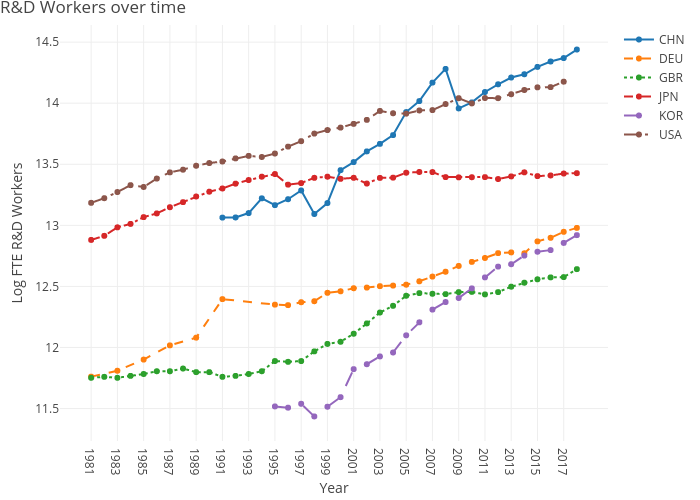
Dvollrath's interactive graph and data of "R&D Workers over time" is a line chart, showing CHN, DEU, GBR, JPN, KOR, USA; with Year in the x-axis and Log FTE R&D Workers in the y-axis.. The x-axis shows values from 0 to 0. The y-axis shows values from 0 to 0.