Edit chart
Loading graph
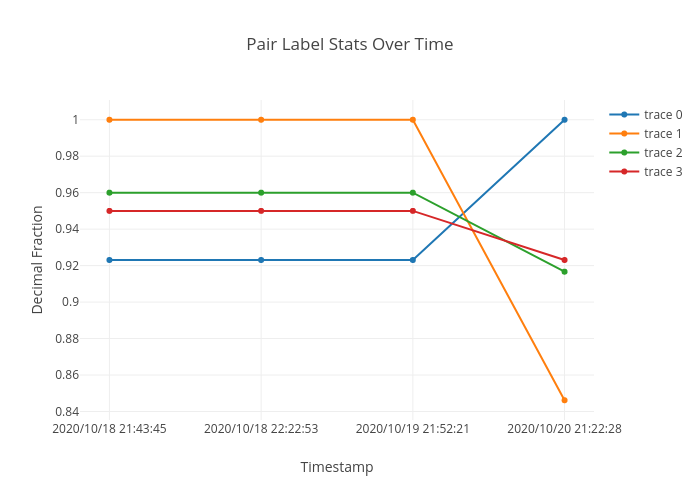
Dmlove's interactive graph and data of "Pair Label Stats Over Time" is a scatter chart; with Timestamp in the x-axis and Decimal Fraction in the y-axis.. The x-axis shows values from 0 to 0. The y-axis shows values from 0 to 0.