Edit chart
Loading graph
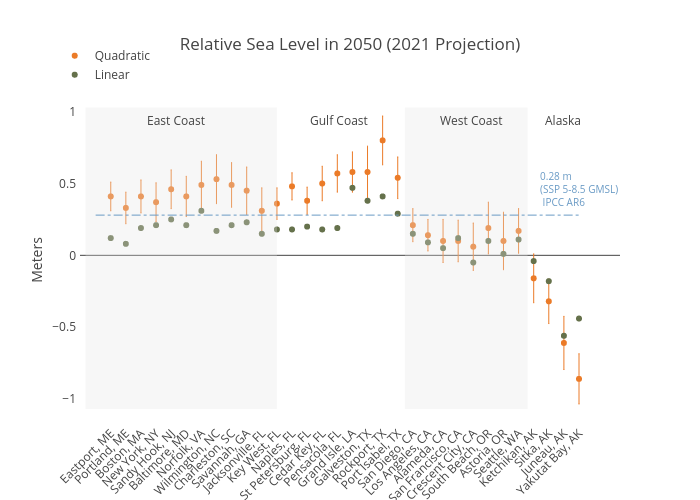
Dlmalm's interactive graph and data of "Relative Sea Level in 2050 (2021 Projection)" is a scatter chart, showing Quadratic vs Linear; with in the x-axis and Meters in the y-axis.. The x-axis shows values from -1.8613354873451802 to 32.86133548734518. The y-axis shows values from -1.146388888888889 to 1.081388888888889. This visualization has the following annotations: East Coast; Gulf Coast; West Coast; Alaska; 0.28 m(SSP 5-8.5 GMSL) IPCC AR6