Edit chart
Loading graph
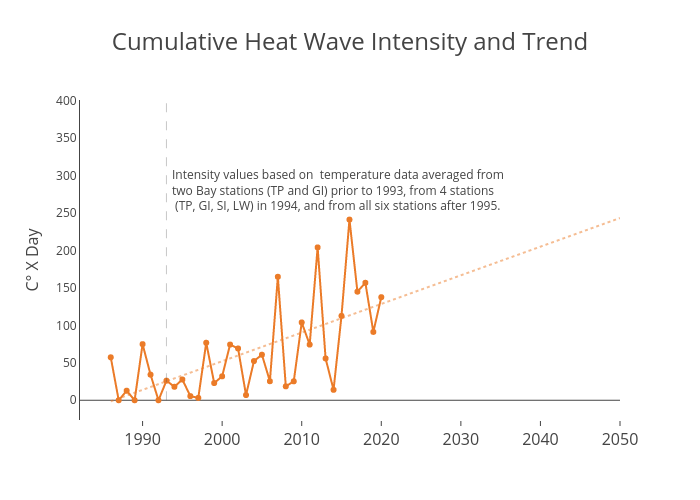
Dlmalm's interactive graph and data of "Cumulative Heat Wave Intensity and Trend" is a , showing Cumulative Intensity vs Linear Projection; with in the x-axis and C° X Day in the y-axis.. The x-axis shows values from 1982.3749047498095 to 2050. The y-axis shows values from -23.504009870450343 to 400.308451573103. This visualization has the following annotation: Intensity values based on temperature data averaged fromtwo Bay stations (TP and GI) prior to 1993, from 4 stations (TP, GI, SI, LW) in 1994, and from all six stations after 1995.