Edit chart
Loading graph
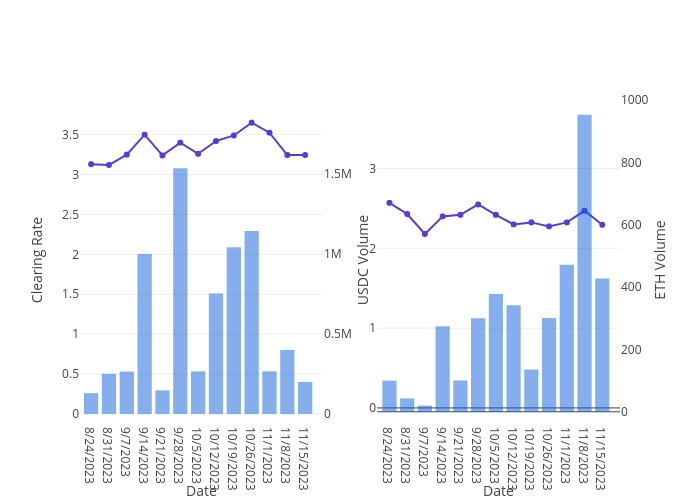
Dionchu's interactive graph and data of "" is a bar chart, showing Clearing Volume, Clearing Rate, Clearing Rate (USDC), Clearing Volume (USDC); with Date in the x-axis and in the y-axis.. The x-axis shows values from 0.29759009142623594 to 14. The y-axis shows values from -0.15132075471698103 to 3.8586792452830188.