Edit chart
Loading graph
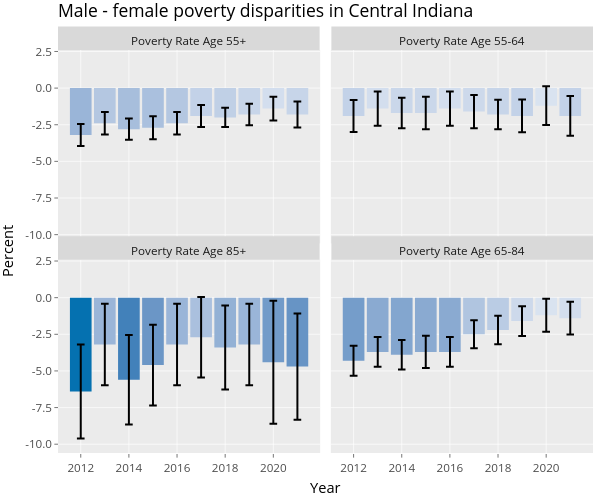
Dietrimj's interactive graph and data of "Male - female poverty disparities in Central Indiana" is a . The x-axis shows values from 2011.055 to 2021.945. The y-axis shows values from -10.6 to 2.6. This visualization has the following annotations: Year; Percent; Poverty Rate Age 55+; Poverty Rate Age 55-64; Poverty Rate Age 85+; Poverty Rate Age 65-84