Edit chart
Loading graph
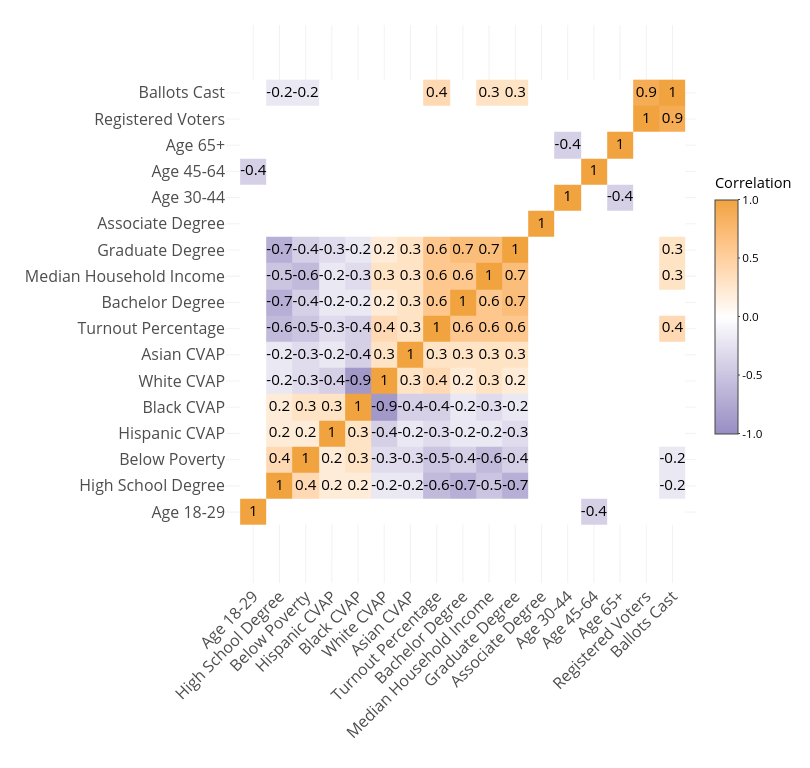
Dietrimj's interactive graph and data of "99_79a72c49387ba0f58f45c455ecac92c2" is a heatmap, showing 99_79a72c49387ba0f58f45c455ecac92c2. The x-axis shows values from -0.04027727978964979 to 17.896856698936297. The y-axis shows values from -1.7306777938824407 to 19.610304637096405.