Edit chart
Loading graph
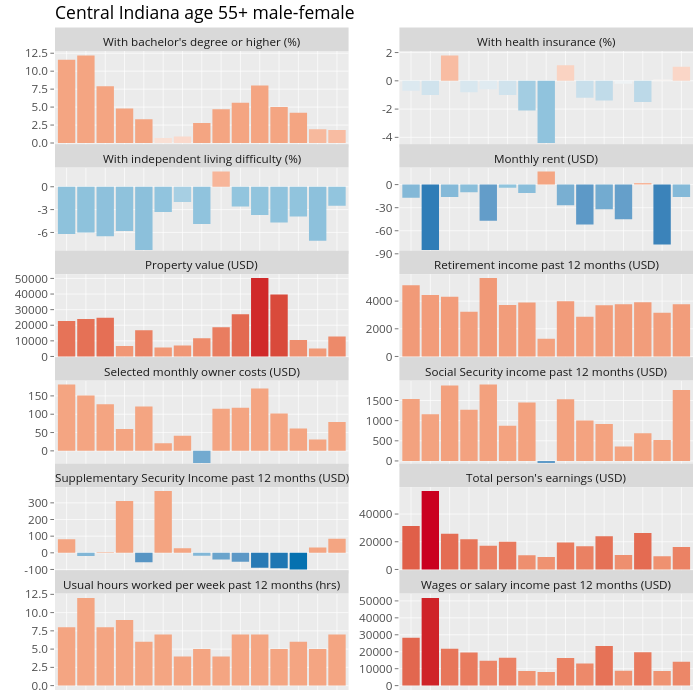
Dietrimj's interactive graph and data of "Central Indiana age 55+ male-female" is a . The x-axis shows values from 0.4 to 15.6. The y-axis shows values from -0.61 to 12.81. This visualization has the following annotations: With bachelor's degree or higher (%); With health insurance (%); With independent living difficulty (%); Monthly rent (USD); Property value (USD); Retirement income past 12 months (USD); Selected monthly owner costs (USD); Social Security income past 12 months (USD); Supplementary Security Income past 12 months (USD); Total person's earnings (USD); Usual hours worked per week past 12 months (hrs); Wages or salary income past 12 months (USD)