Edit chart
Loading graph
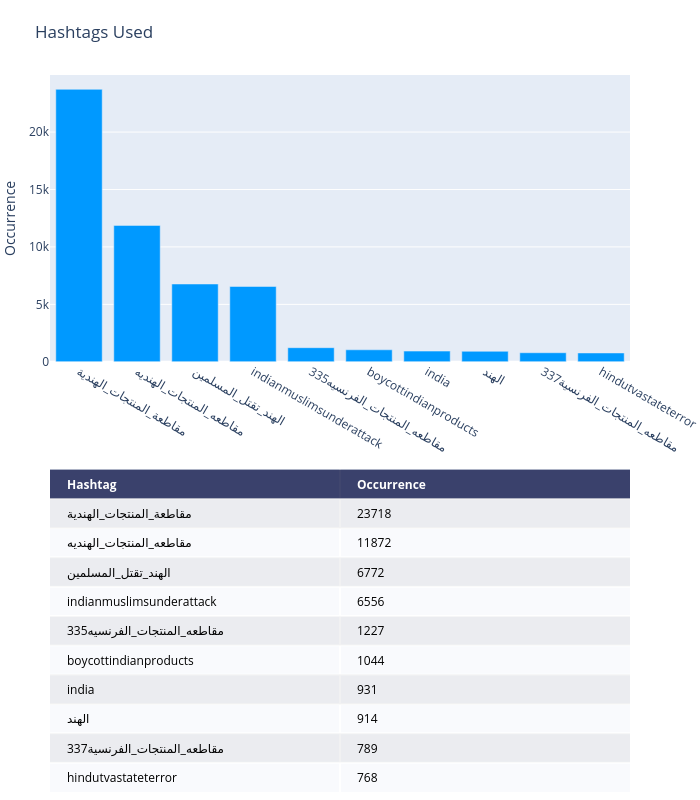
Dfracdeveloper's interactive graph and data of "Hashtags Used" is a heatmap, showing Hashtag. The x-axis shows values from 0 to 0. The y-axis shows values from 0 to 0. This visualization has the following annotations: Hashtag; Occurrence; مقاطعة_المنتجات_الهندية; 23718; مقاطعه_المنتجات_الهنديه; 11872; الهند_تقتل_المسلمين; 6772; indianmuslimsunderattack; 6556; مقاطعه_المنتجات_الفرنسيه335; 1227; boycottindianproducts; 1044; india; 931; الهند; 914; مقاطعه_المنتجات_الفرنسية337; 789; hindutvastateterror; 768