Edit chart
Loading graph
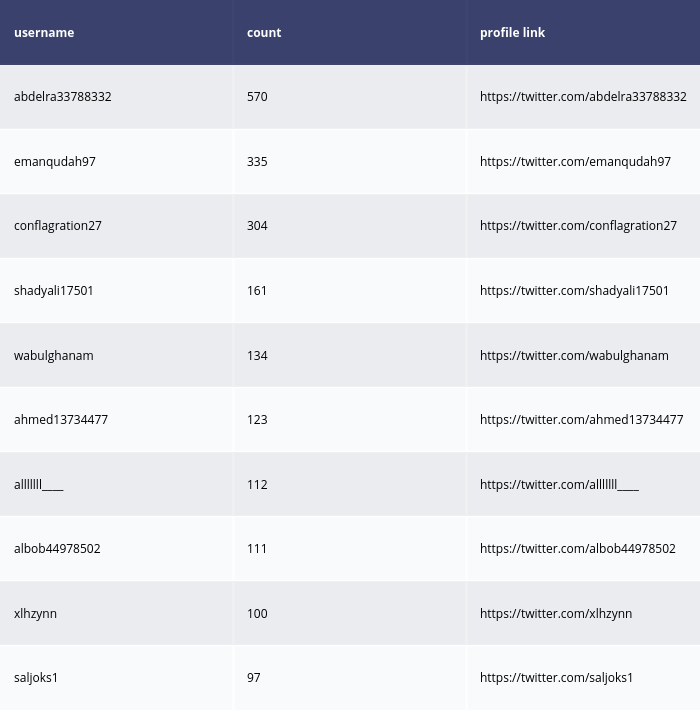
Dfracdeveloper's interactive graph and data is a heatmap. The x-axis shows values from 0 to 0. The y-axis shows values from 0 to 0. This visualization has the following annotations: username; count; profile link; abdelra33788332; 570; https://twitter.com/abdelra33788332; emanqudah97; 335; https://twitter.com/emanqudah97; conflagration27; 304; https://twitter.com/conflagration27; shadyali17501; 161; https://twitter.com/shadyali17501; wabulghanam; 134; https://twitter.com/wabulghanam; ahmed13734477; 123; https://twitter.com/ahmed13734477; alllllll____; 112; https://twitter.com/alllllll____; albob44978502; 111; https://twitter.com/albob44978502; xlhzynn; 100; https://twitter.com/xlhzynn; saljoks1; 97; https://twitter.com/saljoks1