Edit chart
Loading graph
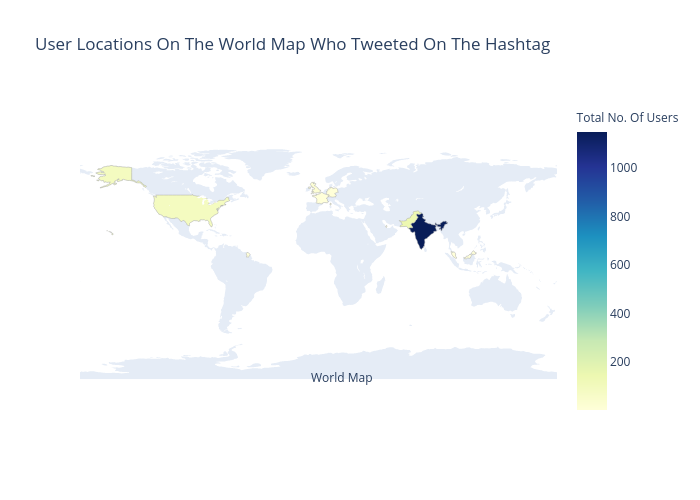
Dfracdeveloper's interactive graph and data of "User Locations On The World Map Who Tweeted On The Hashtag" is a choropleth. The x-axis shows values from 0 to 0. The y-axis shows values from 0 to 0. This visualization has the following annotation: World Map