Edit chart
Loading graph
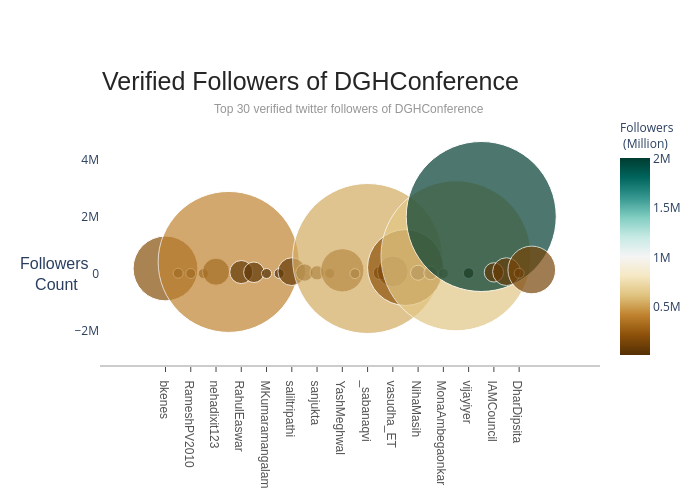
Dfracdeveloper's interactive graph and data is a scatter chart. The x-axis shows values from 0 to 0. The y-axis shows values from 0 to 0. This visualization has the following annotations: Followers Count ; ; Verified Followers of DGHConference; Top 30 verified twitter followers of DGHConference